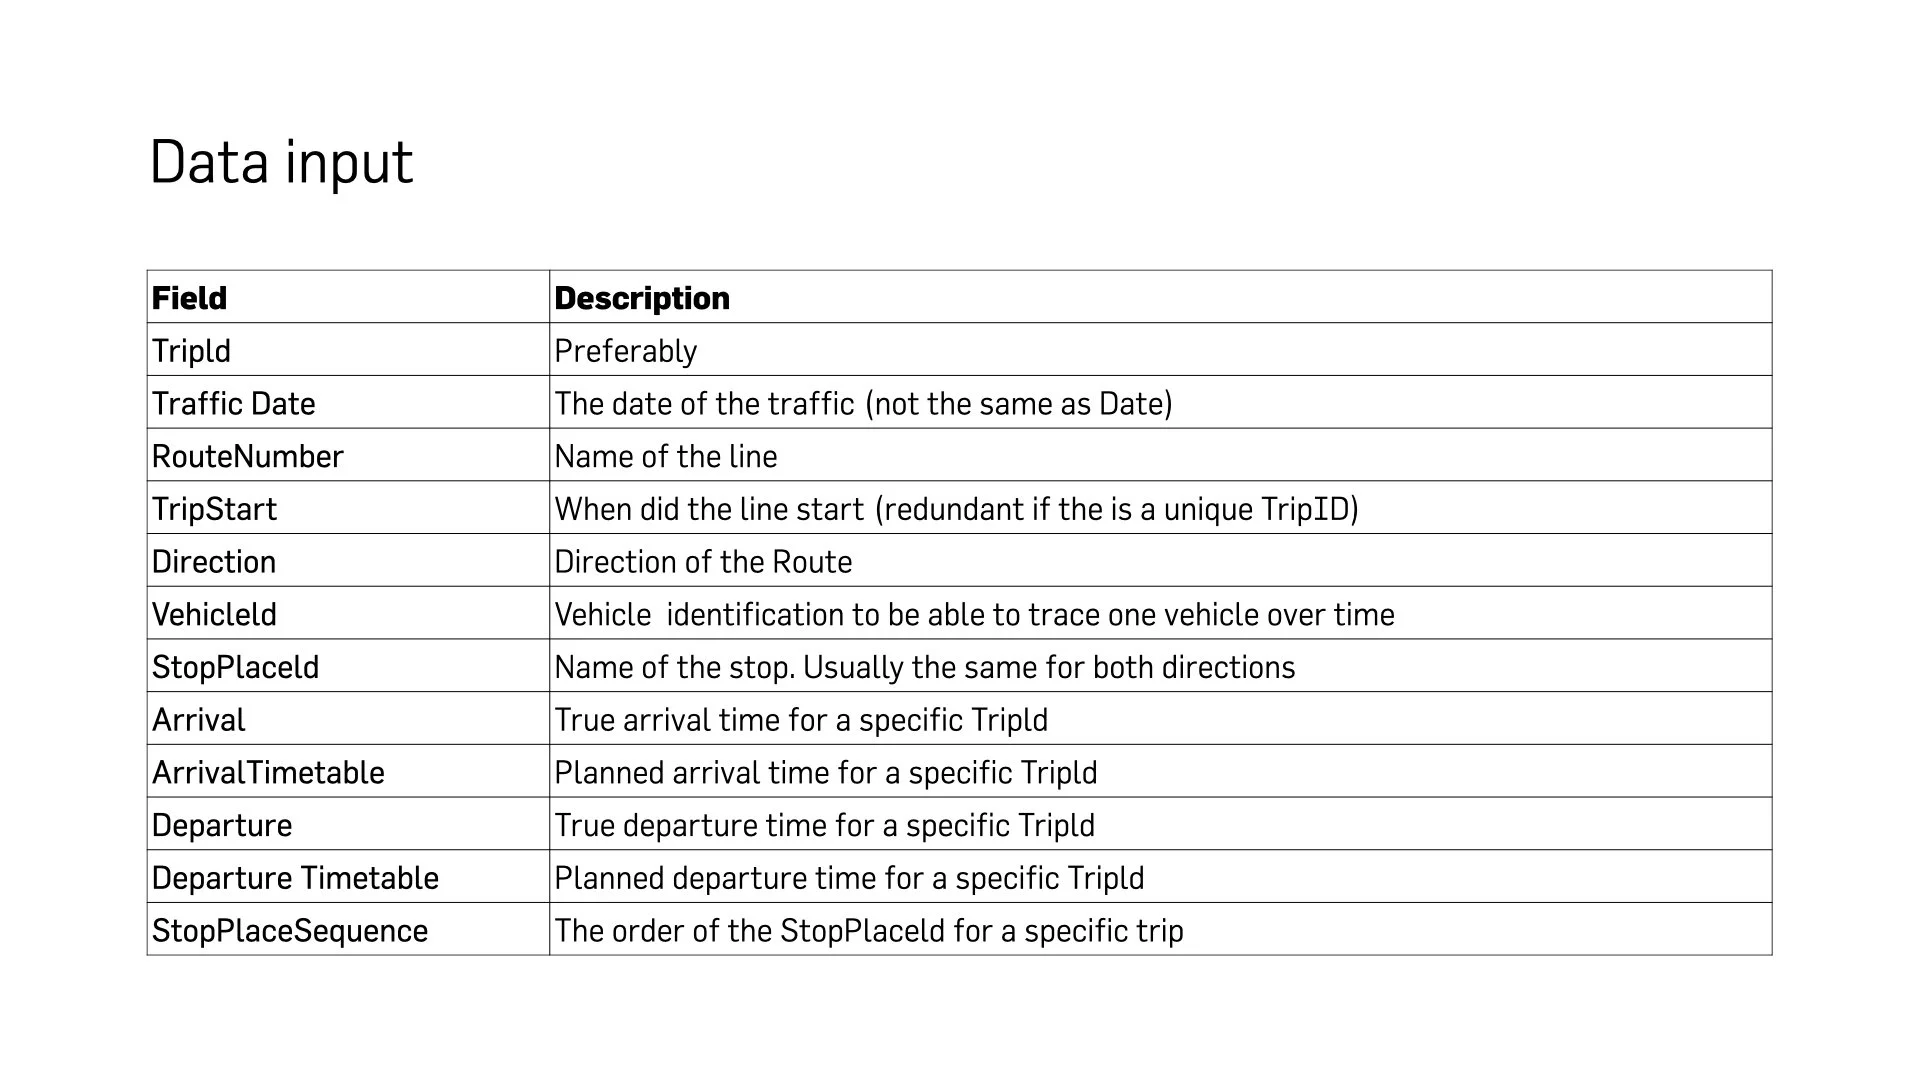
Train delay forecasting
Today, decision making in passenger rail is mainly made by humans. Experienced professionals yes, but human in nature. If we can make pattern recognition available to traffic planning and traffic control then The Train Brain can start automating real time decision-making and revolutionize traffic analysis.
A major cause of train delays is knock-on effects
The risk of deviation from the timetable can be identified both in the moment (the current probability of delay based on where all vehicles are at the moment) and as a historical/general probability of delay tied to vehicle, place or section. Our model for predicting risk of deviation from the time table can be used as a way of reducing risk of knock-on delays of mitigating them once they occur.
The model predicts risk of deviation from the time table
If a closed traffic system operating at high capacity is to function it is necessary for vehicles to be at the planned location at the planned time. The system works we can stick to the plan.
But many factors mean that the plan cannot be kept. We get variance in the outcome.
This variance has a distribution, and that distribution can be described by historical data. But where, within the distribution, will a future vehicle be located? Pattern recognition models can estimate that.
Our train delay forecasting model trains itself to forecast, in real time, the likely future positions of all trains nationwide.
This is done (the variance is explained) by keeping track of where all the trains are - in relation to where all the other trains are right now.
The technology is a form of pattern recognition – those patterns are not a library, they are more like fingerprints. A fingerprint of variance. And those fingerprints are not bound to time and place, they are patterns. We can, for example, use a fingerprint that describes variance in Uppsala to a forecast for Malmö.
The model trains itself – to find all the fingerprints and make as accurate predictions as it can. The goal is a narrow spread in the forecast range.

““Next time your train is delayed. Rest assured, there are people working on it.””

““For commuters in Stockholm, Sweden, things may be looking up.””

““The first automated transit forecasting tool of its kind.””
How the risk of deviation is found
Identify likely train route and arrival/departure times
The model uses historical data to understand which path a train is likely to take. All trains nationwide.
The model uses historical data to understand actual arrival/departure times. All trains in nationwide.
The information is linked to both time and place
Training
The model uses historical data (actual outcomes) to refine the estimates
Clustering and base estimation
The information is clustered in order to form a basis for patterns - where different groups correspond to events that are explained by the same thing (same factor). For each grouping (cluster group) a basic estimate is created.
The format of the base estimate is a cumulative distribution (CDF) of travel times
When the basic estimate is not correct, the model goes backwards to try to understand what happened - why did it go wrong? And it tries to capture the cause.
The model deviates from the basic estimate when it receives new information that affects the running time. Where the model is most wrong, it focuses its training efforts. A consequence: Short distances then receive less attention in training than long distances.